Oops! Something went wrong while submitting the form.
INDUSTRY INSIGHTS
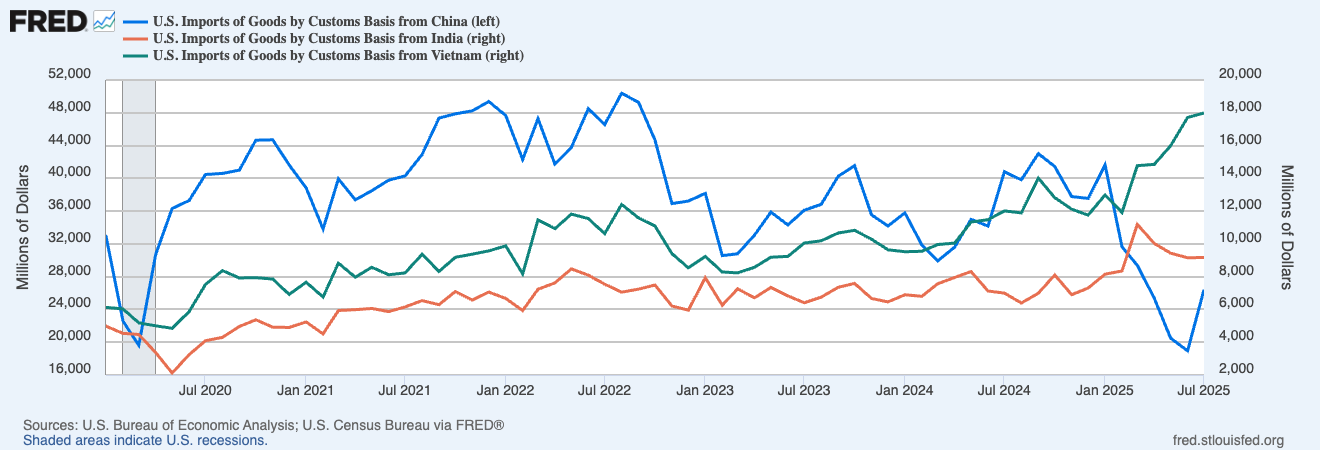
India Is Losing US Market to Vietnam and China as Tariffs Bite - An Assessment
Exports to the U.S. Decline for Fourth Consecutive Month Down 37.5% (May–September 2025)
Introduction
India’s exports to the United States, its largest trading partner have sharply declined following significant tariff increases imposed by the U.S. government. Between May and September 2025, total shipments dropped 37.5%, sliding from $8.8 billion to $5.5 billion, marking one of the steepest short-term declines in recent years.
The Global Trade Research Initiative (GTRI) conducted this analysis comparing export data for May–September 2025 to evaluate the immediate fallout of tariff measures introduced from April 2, 2025. The duties started at 10%, were raised to 25% on August 7, and reached 50% by the end of August.
Tariff Exposure vs. Export Resilience Matrix
Purpose: Visually classifies export sectors by how heavily they’re exposed to U.S. tariffs versus how resilient their performance has been despite the tariffs.
Low Tariff Exposure
High Tariff Exposure
High Export Resilience (Low decline %)
Pharmaceuticals: PLI support cushioned fall (-15.7%)
Auto Components: modest drop (-12%)
Iron & Steel: limited impact despite tariff parity (-8%)
Low Export Resilience (High decline %)
Smartphones: sharp fall despite zero tariffs (-58%)
Textiles, Gems & Jewellery, Solar Panels, Chemicals, Marine Products, Agri-Foods (-33% to -60%)
Key Takeaways:
The smartphone and textile sectors show unexpected vulnerability even without major tariff discrimination, they suffered heavy setbacks, pointing to supply chain concentration risks.
Conversely, auto components and metals displayed resilience, hinting at sticky buyer relationships or strong U.S. demand continuity.
Market Dependence vs. Tariff Intensity Matrix
Purpose: Highlights where India’s over-dependence on the U.S. market coincides with punitive tariff exposure guiding policymakers where diversification or incentives are most urgent.
Low U.S. Market Dependence
High U.S. Market Dependence
Low Tariff Intensity
Metals, Machinery, Auto Parts: globally diversified export base
Pharmaceuticals: limited tariff, but over-reliant on U.S.
High Tariff Intensity
Solar Panels, Chemicals: high tariff impact but diversified markets
Textiles, Gems & Jewellery, Marine & Agri-Food: double hit — high tariffs + heavy U.S. reliance
Insight:
Sectors in the bottom-right quadrant (Textiles, Gems, Marine, Agri) face a dual vulnerability, both market concentration and tariff discrimination.
This is where policy relief and diversification efforts (FTA with EU/UK, MEA route expansion, export credit support) should be prioritized.
Performance Across Tariff Categories
To assess the impact comprehensively, Indian exports to the U.S. were classified into three groups:
Tariff-free products
Uniform-tariff goods (same for all suppliers)
India-specific high-duty goods (50%)
Category A: Tariff-Free Exports Show the Steepest Fall
Ironically, products that faced no additional tariffs recorded the sharpest decline. These accounted for roughly one-third of India’s total exports and fell 47%, from $3.4 billion in May to $1.8 billion in September. The main sectors hit were smartphones and pharmaceuticals.
Smartphones: Exports, which had surged by 197% between April–September 2024 and the same period in 2025, collapsed 58%, dropping from $2.29 billion in May to $884.6 million in September.
Month-on-month declines were steady:
Month
Export Value (US$ Billion)
June 2025
US$ 2.00 B
July 2025
US$ 1.52 B
August 2025
US$ 0.97 B
September 2025
US$ 0.88 B
Pharmaceuticals: Exports decreased 15.7%, from $745.6 million to $628.3 million.
Despite being exempt from tariffs and supported by India’s PLI (Production-Linked Incentive) scheme, these two sectors experienced significant setbacks.
Category B: Moderate Weakness in Uniform-Tariff Sectors
Industries such as industrial metals and auto components, which faced uniform tariffs applied globally, showed a 16.7% decline (from $0.6B to $0.5B).
Aluminum: –37%
Copper: –25%
Auto parts: –12%
Iron & Steel: –8%
Since all supplier countries faced equal tariff rates, the decline appears more tied to reduced U.S. industrial demand rather than a loss of Indian competitiveness.
Sectors hit with India-only 50% tariffs including textiles, gems & jewellery, chemicals, agriculture, and machinery represent nearly 60% of India’s U.S. export basket. Their exports fell 33%, from $4.8B in May to $3.2B in September.
Key Sector Impacts:
Gems & Jewellery: Exports dropped 59.5%, from $500.2M to $202.8M, with Thailand and Vietnam gaining lost U.S. orders.
Gold jewellery: –58%
Diamond-studded: –63%
Lab-grown: –37%
Cut & polished diamonds: –54%
Lab-grown diamonds: –89%
Solar Panels: Exports plunged 60.8%, from $202.6M to $79.4M, largely because China (30%) and Vietnam (20%) face much lower tariffs.
Textiles & Garments: Fell 37% (from $944M to $597M).
Chemicals: Declined 35% (from $537M to $350M). Agrochemicals fell 37%, essential oils 44%. Clusters in Vapi, Dahej, Ankleshwar, Vizag, Maharashtra, and Karnataka were most affected.
Marine & Seafood: Dropped 49% (from $223M to $113M). Vannamei shrimp exports were down 51%, processed seafood 22%. Key coastal hubs—Nellore, Bhimavaram, Kakinada, Paradeep, Veraval, Porbandar—saw major disruptions.
Resins –61% Major losses hit production belts across Nashik, Gujarat, Kerala, Karnataka, Jharkhand, and Chhattisgarh, wiping out two years of gains.
Policy Outlook and Recommended Actions
Exporters are urging immediate government intervention to cushion the blow and prevent long-term erosion of India’s market share. Recommended measures include:
Enhanced interest equalisation to reduce financing costs
Faster duty remission to ease liquidity constraints
Emergency credit support for MSME exporters
Without timely relief, India risks losing ground to competitors like Vietnam, Mexico, and China even in sectors where it previously held strong positions.
The data underscores a critical takeaway: tariffs have not only narrowed profit margins but have exposed deeper structural weaknesses across India’s key export sectors.
Citation and Data Sources: DGCI&S, USITC DataWeb (U.S. Trade & Tariff Data), GTRI and private databases, FRED
Thank you! Your submission has been received!
Oops! Something went wrong while submitting the form.