
Every year, businesses face a seemingly simple question: how much carbon did the business emit?
The data needed to answer it is spread across the organization. Fuel bills sit with the plants, electricity invoices with finance, and freight movements with your logistics team and dozens of transporters. Pulling all of it into one spreadsheet once a year usually means filling gaps with averages and assumptions.
That approach is becoming harder to defend as sustainability disclosures face greater scrutiny. For India’s largest listed companies, independent assessment or assurance requirements make reliable, traceable emissions data more important than before. From FY 2026-27, the top 1,000 listed companies in India need their BRSR Core disclosures independently assessed or assured, and those disclosures include greenhouse gas emissions. A number built on assumptions now has to hold up when a third party checks it.
Carbon accounting software replaces the annual spreadsheet with a system that:
This blog covers how carbon accounting software works, how it handles each emission scope, how it differs from a carbon footprint calculator, and how to turn its output into actual reductions.
Carbon accounting software is a system that measures, records and reports the greenhouse gas emissions your business produces, using data from your day-to-day operations.
At its core, carbon accounting is one calculation repeated many times. You take an activity, such as litres of fuel burned, units of electricity used or tonnes of goods moved, and multiply it by an emission factor. An emission factor is the amount of emissions one unit of that activity produces.
Take a truck that burns 1,000 litres of diesel. India’s default emission factor for road diesel is about 2.675 kg of CO₂e per litre, published by Smart Freight Centre India. That trip adds roughly 2.7 tonnes of CO₂e to your footprint. CO₂e, or carbon dioxide equivalent, expresses all greenhouse gases in one common unit.
The calculation itself is straightforward.. The hard part is doing it consistently across every fuel bill, meter reading and shipment in your business. Carbon accounting software makes that process repeatable across your operations.
A carbon accounting platform does three things a spreadsheet struggles with:
Most carbon emissions accounting software follows the GHG Protocol Corporate Standard. It’s the most widely used framework for measuring emissions and the one that defines Scope 1, 2 and 3.
Carbon accounting software follows the same five steps every reporting cycle. What changes over time is how much of each step runs automatically and how precise the data feeding it is.
The software pulls activity data from the systems where it already lives, for example:
The more of this that comes in directly, the less your team retypes and the fewer gaps get filled with estimates.
Each activity is matched to an emission factor and converted to CO₂e. The precision depends on the method the data allows. Take freight emissions, ranked from most to least precise:
Good carbon emissions tracking software lets you start with whatever data you have and move to more precise methods as better data becomes available.
Every calculated figure is tagged to a scope:
We cover each scope, and where freight fits, in more detail below.
The software rolls the numbers up into reports. You can view totals by scope, plant, product line or transporter, in formats that match frameworks like BRSR, GRI and CDP. Each figure stays linked to the activity data and factor behind it, so an assessor can check how it was calculated.
Once emissions are broken down this finely, the biggest sources stand out: a plant, a lane or a transporter. That’s where reduction work starts. Later in this blog, we walk through how to turn that data into a reduction plan.
The benefits of carbon accounting software go beyond saving time on reporting. The bigger change is what you can do with emissions data once it’s reliable and detailed.
Every figure links back to the activity and emission factor behind it. When an assessor or assurance provider asks how you arrived at a number, you can show the source instead of rebuilding the logic from an old spreadsheet. This matters most for the BRSR Core disclosures that now need independent assessment or assurance.
When activity data flows in through the year, the annual report becomes a matter of pulling numbers that already exist. Your sustainability team spends less time chasing plants, finance and logistics for data, and more time on what the numbers mean.
A reduction target only means something if this year’s number is calculated the same way as last year’s. The software applies the same methods and factors across periods. That way, a drop in emissions reflects a real change in operations, not a change in how someone filled in the spreadsheet.
Company-wide totals don’t tell anyone what to change. Breaking emissions down by plant, product, lane or transporter does. It turns carbon emissions management from a reporting exercise into something your operations teams can act on.
In freight, this often lines up with cost. Empty return trips, underused trucks and longer routes burn more fuel, which raises your freight costs and your emissions at the same time.
If you supply to large brands, their sustainability teams may ask for emissions data on the goods and shipments you provide. With carbon accounting already running, you can answer from your system instead of starting a one-off exercise for each request.
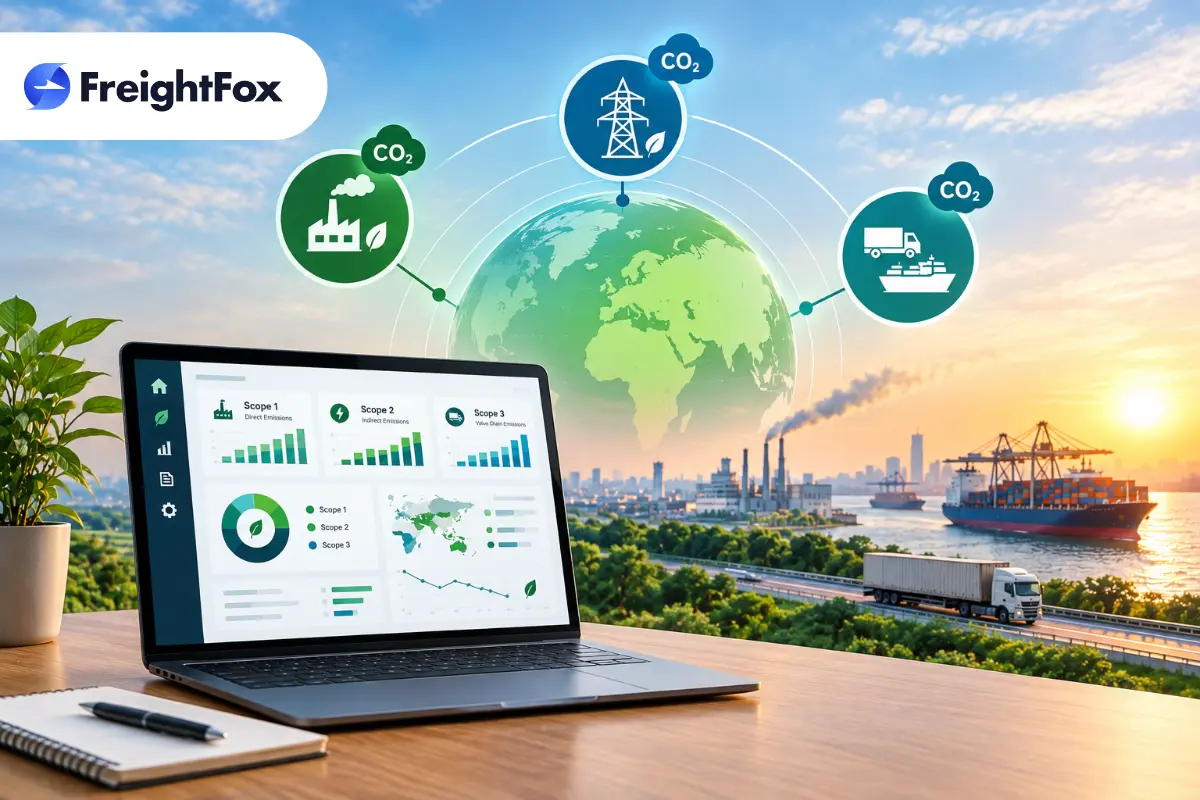
The GHG Protocol splits your emissions into three scopes, based on who controls the source. A carbon accounting system handles each scope differently, because the data for each one sits in a different place.
Scope 1 emissions are direct emissions from sources you own or control. Think boilers, furnaces, diesel generator sets and any vehicles in your own fleet.
The data usually comes from fuel purchase and consumption records at your plants. Since you hold this data yourself, Scope 1 is typically the most precise of the three.
Scope 2 emissions come from the electricity (and any steam or heat) you purchase. The source is your meter readings and utility bills.
The software multiplies your consumption by a grid emission factor. In India, that factor comes from the Central Electricity Authority’s CO₂ baseline database. If you buy renewable power, the software records it separately so it lowers your Scope 2 figure.
Scope 3 emissions cover everything else across your value chain. That includes raw materials you buy, freight moved by transporters, business travel, and the use and disposal of what you sell. The GHG Protocol groups these into 15 categories.
For many manufacturers, Scope 3 is the largest share of the footprint, and also the hardest to measure, because the data sits with other companies. Most businesses start with spend-based estimates and replace them with activity data or supplier data over time.
Under SEBI’s BRSR format, the reporting obligations differ by scope:
Reporting only Scope 1 and 2 meets the requirement, but it can leave out the biggest part of your footprint.
Freight can land in different scopes depending on who owns the trucks and who pays for the move:
If you hire transporters rather than run your own fleet, almost all of your freight emissions are Scope 3.
Freight is also one of the few Scope 3 categories where you already hold detailed data. Every trip in your logistics records has an origin, destination, weight and vehicle type. That means freight can be measured with distance-based activity data instead of spend estimates, which is what carbon accounting software for logistics is built to do.
A carbon footprint calculator and carbon accounting software both give you an emissions number, but they’re built for different jobs.
A calculator is a quick estimate. You enter a few figures, such as annual electricity use, fuel spend or kilometres driven, and it applies average emission factors to return one total. It’s useful when you want a rough baseline or a sense of where your biggest sources might be.
Carbon emissions accounting software is a system you run every reporting cycle. It works from detailed activity data, keeps every calculation traceable, and breaks the result down so different teams can act on it.
A simple way to decide: if the number only needs to inform you, a calculator is enough. If it has to go into a BRSR report, face an assessor, or show whether a reduction plan is working, you need the precision and traceability of software.
The two often work in sequence. Many businesses run a calculator first to see roughly where they stand, then move to a carbon accounting platform once reporting and reduction start to matter.
Measuring emissions is the starting point. The value comes from using that data to decide what to change, and then checking whether the change worked.
Here’s how that works on a single freight lane, step by step. The figures are illustrative.
Your carbon accounting software shows that freight produced 4,200 tonnes of CO₂e last year across 60 lanes. This is your baseline, and every target and result from here on is measured against it.
You sort lanes by total emissions. Pune to Chennai sits near the top at 310 tonnes. Together with four other lanes, it makes up nearly a quarter of your freight emissions, so that’s where you start.
A lane can rank high simply because it moves a lot of goods over a long distance. That alone doesn’t mean something is wrong. So you check emissions intensity, the CO₂e per tonne-km.
Pune to Chennai runs about 30% above lanes of similar distance. Your freight analytics data shows why: orders are dispatched daily as they come in, so trucks leave at around 60% of their capacity.
You set a target to cut emissions intensity on this lane by 15% within a year.
You choose an intensity target rather than an absolute one because volumes on this lane are growing with sales. An absolute target would penalize growth. An intensity target measures whether each tonne moves more efficiently.
The cause is low utilization, so the fix is consolidation. You move dispatches on this lane to three fixed days a week and shift to larger vehicles. Trucks now leave at around 85% of capacity, and the lane needs fewer trips for the same volume.
Other lanes will have other causes, and each points to a different lever:
These are the core practices of green logistics, and many of them cut freight cost at the same time.
You track the lane’s intensity every month, calculated the same way as the baseline. After one quarter, it’s down 11%, so the change is working. Had it barely moved, you’d know early enough to try something else, instead of finding out in next year’s annual report.
FreightFox is freight management software for Indian manufacturers. Its Decarbonize module covers one specific part of your footprint: the Scope 3 emissions from moving your goods, inbound and outbound.
It doesn’t cover your plants’ fuel and electricity (Scope 1 and 2) or other Scope 3 categories like purchased materials. For those, you’d use a broader carbon accounting tool. What FreightFox adds is trip-level data for freight, the Scope 3 category you can measure most precisely.
FreightFox calculates freight emissions using its LEAP (Logistics Emissions Abatement Platform) framework. It combines shipment-level data (origin, destination, distance, weight, vehicle type and fuel) into standardized CO₂e values per tonne-km. This is the distance-based method described earlier, applied to every trip rather than estimated from freight spend.
Emissions sit on the same platform as procurement, execution and tracking, alongside FreightFox’s freight visibility software and supply chain control tower. So emissions data can be read next to the cost and service data for the same lanes and transporters.
To date, FreightFox has mapped over 200,000 tonnes of CO₂e across logistics value chains.
An emissions number now has two jobs:
A spreadsheet assembled once a year struggles with both. Carbon accounting software handles them by calculating from real activity data, keeping every figure traceable, and measuring progress the same way each period.
For most manufacturers, freight is a practical place to start. Unlike many Scope 3 categories, you already hold detailed trip data for it, and the same inefficiencies that raise freight emissions also raise freight cost.
Freight emissions are easier to manage when you can see them alongside freight cost and service performance. FreightFox helps manufacturers measure Scope 3 freight emissions at the shipment level, compare emissions intensity across lanes and transporters, and identify opportunities to improve logistics efficiency.
If freight emissions are part of your sustainability goals, book a demo to see how FreightFox can help you measure and manage them.
You can also explore FreightFox solutions to see how emissions tracking fits alongside procurement, execution and settlement.

See how leading enterprises are optimizing freight costs, performance, and emissions with FreightFox — all in one platform.
FreightFox is a full-stack TMS and Control Tower platform that helps enterprises streamline freight procurement, execution, visibility, settlement, and sustainability—from Procure-to-Pay