
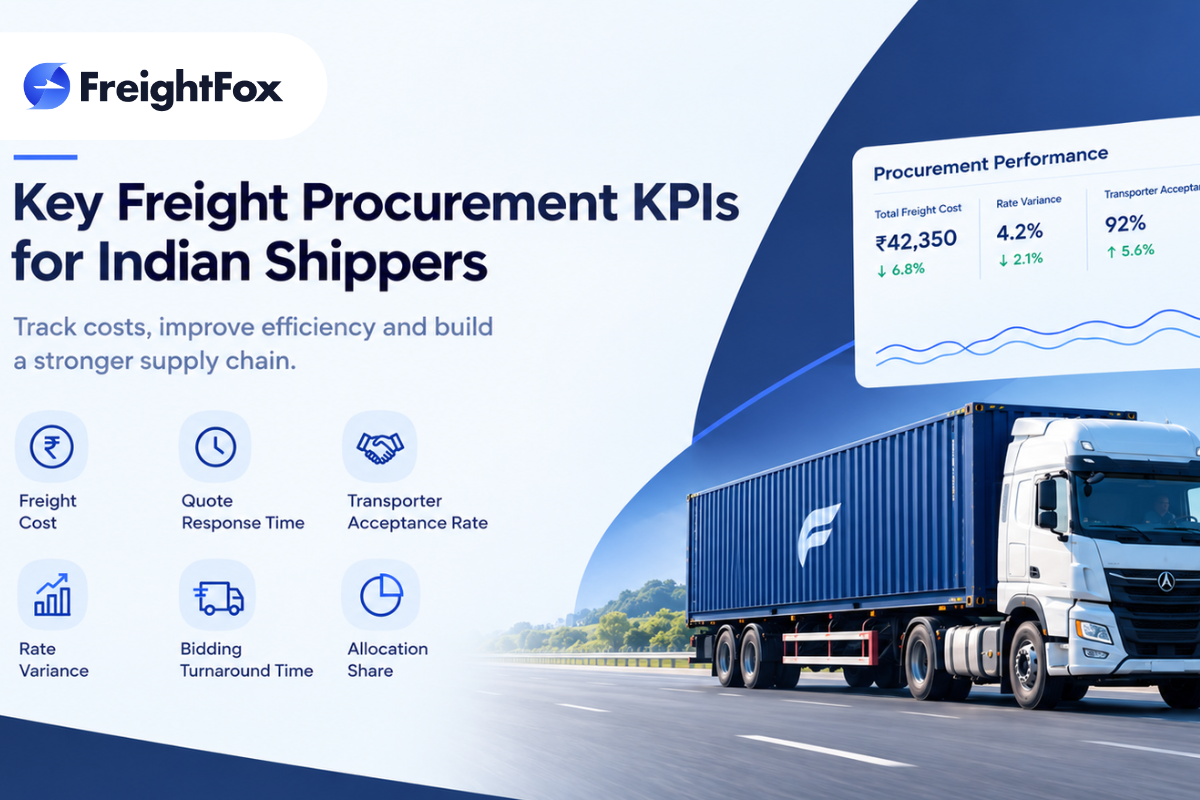
Most shippers in India can tell you what they paid for freight last month. Far fewer can tell you whether their procurement process actually worked. Did the rates they locked in hold up? Did transporters respond on time? Did the awarded transporter really show up with the truck?
That gap is where freight procurement KPIs come in. They turn procurement from a once-a-year negotiation into something you can measure, review and improve every month. This guide covers the KPIs Indian road-freight procurement teams can start tracking, how to calculate them, how to read them together, and the mistakes that make the numbers misleading.
Freight is one of the largest controllable costs for manufacturers, FMCG companies and distributors in India. Yet procurement is often judged on a single number: the rate agreed at the time of contract or auction. That number says very little about what happens after the award.
A good rate on paper can still leave you paying more if transporters reject loads, if you keep falling back to expensive spot hires, or if quotes arrive too late to plan dispatches. Measuring procurement performance helps you see these leaks early.
There are three practical reasons to track it:
Tracking the right freight procurement metrics also makes your next tender stronger, because you walk in with evidence rather than assumptions.
For teams that want to see how procurement KPIs sit alongside the wider picture, such as on-time delivery, inventory and order accuracy, it helps to look at the broader supply chain metrics that operations teams already review.
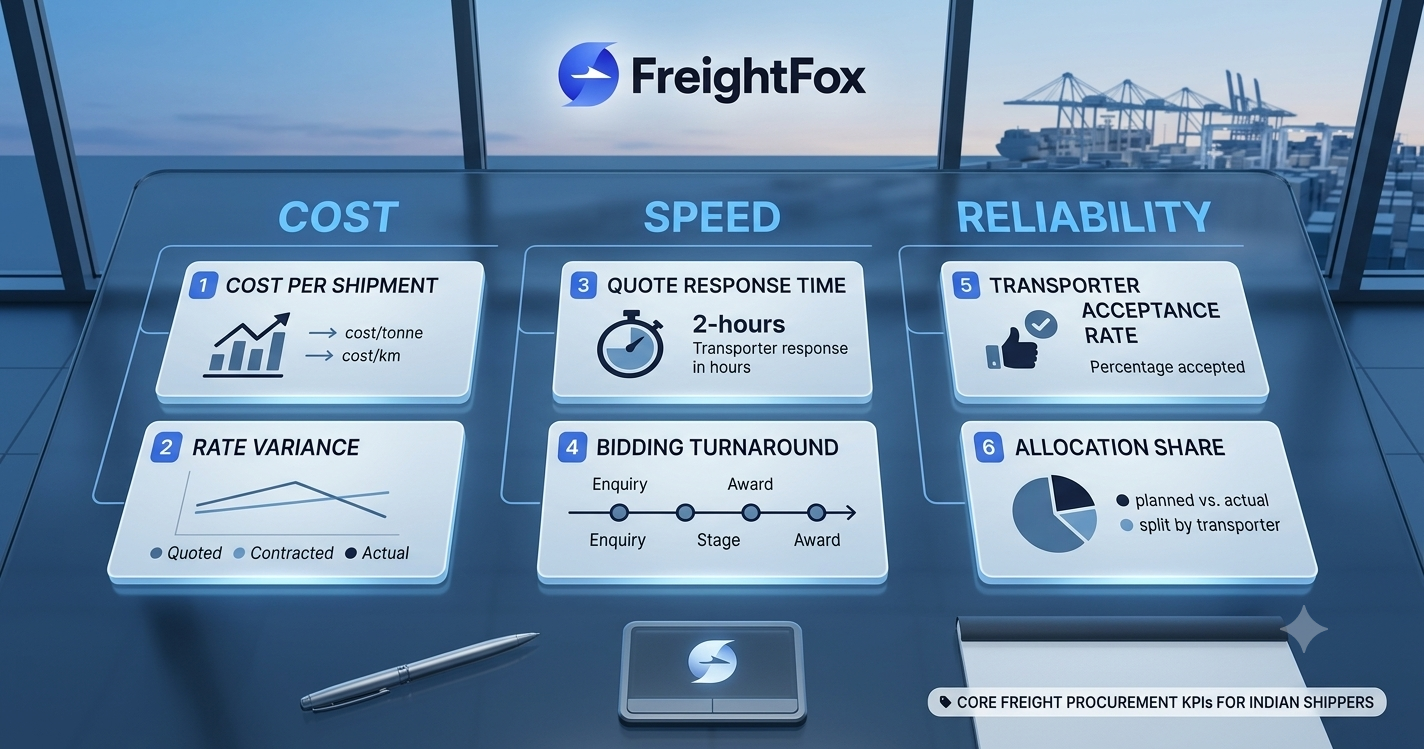
You do not need twenty KPIs. For most Indian shippers, a short list that covers cost, speed and reliability is enough to start. Here are the core freight cost KPIs and process metrics worth tracking:
The sections below explain how each one works and what it tells you.
Cost per shipment is the total freight paid divided by the number of shipments in a period. It is simple, but it becomes far more useful when you slice it by lane, vehicle type and load size. A single blended average hides the fact that a Mumbai to Delhi full truck load and a short intra-state run behave very differently.
For a fairer view, many teams also track cost per tonne or cost per kilometre. These help when load weights and distances vary a lot across your network.
Rate variance compares what you expected to pay with what you actually paid. It can be measured in three ways:
Here is a simple, illustrative example. Suppose a shipper agrees a contracted rate of ₹42,000 for a 32 ft container truck on a given lane, but the freight actually billed over a month averages ₹46,000 because of detention, additional charges and spot hires. The rate variance is ₹4,000, or roughly 9.5 percent. That gap is the real cost of the contract, and it only becomes visible when you track it. (This figure is illustrative only and does not represent any customer result.)
When you want to check whether your rates are reasonable in the first place, freight rate benchmarking gives you an external reference point by comparing your lane rates against comparable routes and vehicle categories.
Speed matters in procurement more than many teams admit. If transporters take days to respond, or if your own team takes days to compare and award, the rates you collected may already be stale by the time they are used.
This is the time between sending an enquiry and receiving a transporter's quote. Track it by transporter. A transporter who consistently responds within hours is easier to plan around than one who needs several reminders. Slow responders also signal weak interest in your lanes, which is useful to know before the next tender.
Bidding turnaround time covers the full cycle from publishing the enquiry to awarding the lane. These freight bidding metrics help you see where time is lost: waiting for quotes, clarifying specifications, internal approvals, or negotiation rounds.
A useful habit is to split the cycle into stages and measure each one. If most of the delay sits in internal approvals rather than transporter response, the fix is a process change on your side, not more chasing of transporters.
Teams running frequent lane-level or spot enquiries often move this work onto freight procurement software so that quote collection, comparison and award happen in one place.
Awarding a lane is not the same as getting trucks on that lane. Two KPIs close this gap.
Allocation share is the percentage of loads actually given to each transporter compared with the planned split. If your plan was 60 percent to your primary transporter and 40 percent to the backup, but the real split drifted to 35 and 65, your procurement outcome is not being followed in execution.
Acceptance rate is the percentage of allocated loads that a transporter accepts.that a transporter accepts and fulfils.
Acceptance rate = (loads accepted ÷ loads allocated) × 100
A low acceptance rate usually means one of three things: the contracted rate is below market, the lane is unattractive to that transporter, or capacity is stretched. Whichever it is, low acceptance pushes your team towards last-minute spot hiring, which typically costs more and feeds directly back into higher cost per shipment.
This is why transportation procurement performance cannot be judged on rates alone. A cheap rate that is rarely honoured is not really cheap.
Each KPI tells part of the story. The real insight comes from reading them together, ideally lane by lane, on a monthly rhythm.
A few patterns to look for:
A simple routine works well. Once a month, pick your top lanes by volume, review the six KPIs for each, note the one or two that moved most, and agree an action with operations and the transporter. Over a few cycles, you build a clear picture of which lanes and partners deserve more volume.
Pulling this data together by hand across spreadsheets, emails and transporter updates is slow, which is where freight management software helps by keeping procurement and execution records in one place.
Even well-meaning KPI tracking can mislead. Watch out for these common mistakes:
FreightFox is a TMS and control tower platform for enterprises, and its Procure module covers contract auctions, spot auctions and RFQs. Running procurement events in one system means quote and award activity is recorded as part of the process, which gives teams a cleaner base for the procurement KPIs covered above.
FreightFox also offers Pulse, which provides analytics and reports on freight data, so teams can review their numbers without stitching them together manually from separate files.
The right set of KPIs and the right level of reporting will depend on your network, your lanes and your transporter mix. A demo is a good way to see how these modules could fit your own procurement process.
Good freight procurement does not end when the rate is agreed. The real test is what happens afterwards: whether you pay what you planned, whether transporters respond and accept loads, and whether the awarded split is actually followed.
A short set of freight procurement KPIs, reviewed lane by lane and read together, gives Indian shippers a clear and practical way to find those gaps and fix them. Start small, define each metric clearly, and build a monthly review habit.
If you want to see how structured procurement and reporting could work for your network, book a demo with FreightFox.

See how leading enterprises are optimizing freight costs, performance, and emissions with FreightFox — all in one platform.
FreightFox is a full-stack TMS and Control Tower platform that helps enterprises streamline freight procurement, execution, visibility, settlement, and sustainability—from Procure-to-Pay


